Finance Data Dashboard
Dashboard
Django
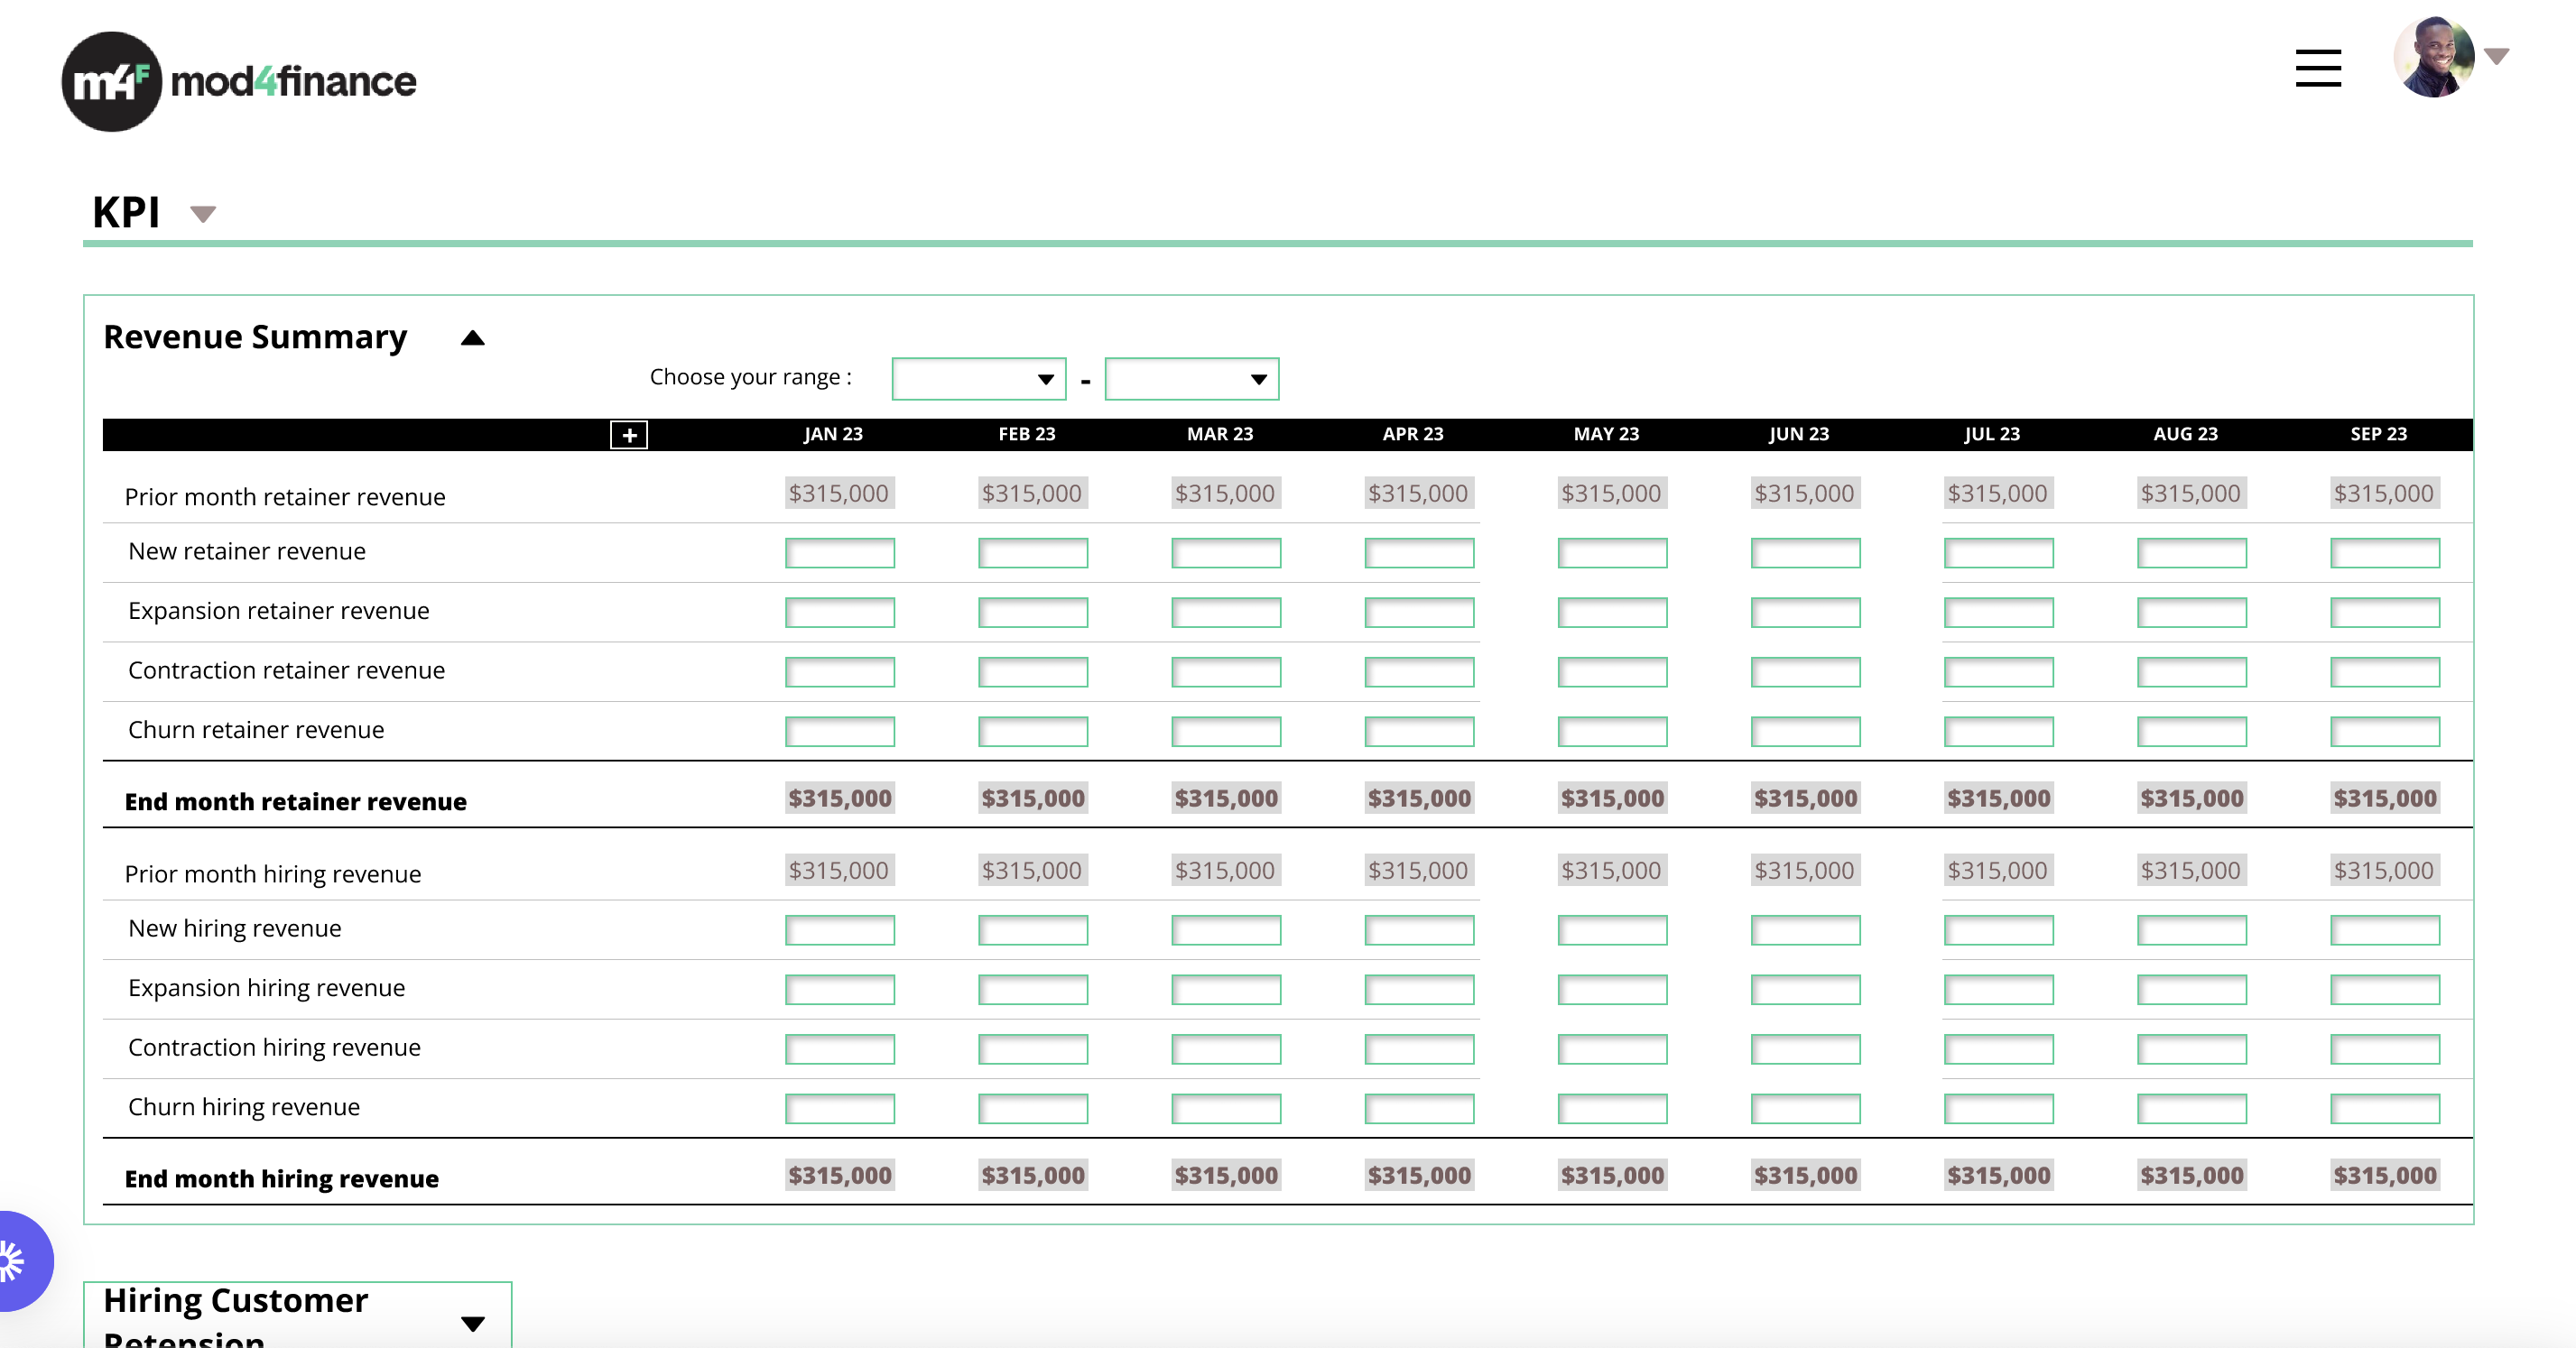
The Finance Data Dashboard is a comprehensive tool built for financial analysts to visually explore and analyze financial year data. The dashboard allows clients to select various financial parameters, such as income statements, KPIs, balance sheets, and cash flow, to view and compare their financial data across different periods.
Features
- Parameter-Based Visualization: Users can select from various financial parameters, including KPIs, income statements, balance sheets, and cash flow, to generate visual reports.
- Year-over-Year (YoY) Analysis: Offers insights into year-over-year performance to track growth, profitability, and financial stability.
- Budget vs. Actuals Comparison: Provides a detailed comparison between budgeted figures and actual financial performance for better forecasting.
- Interactive Dashboard: Easy-to-navigate tabs allow users to switch between different sections, offering a clear view of each financial metric.
- Customizable Reports: Users can filter data to focus on specific time periods or financial indicators that matter most to their analysis.
Technology STack
FRONT END
Interactive interface for financial data visualization, providing a user-friendly experience for navigating through various financial metrics.
DATA VISUALIZATION
Python libraries like Matplotlib, Plotly, or Power BI - Used to create dynamic charts and graphs representing financial data.
BACK END
Python-based data processing, ensuring real-time updates and accurate financial analysis for decision-making.