Survey Dashboard
Dashboard
Python
NLP
Data Analysis
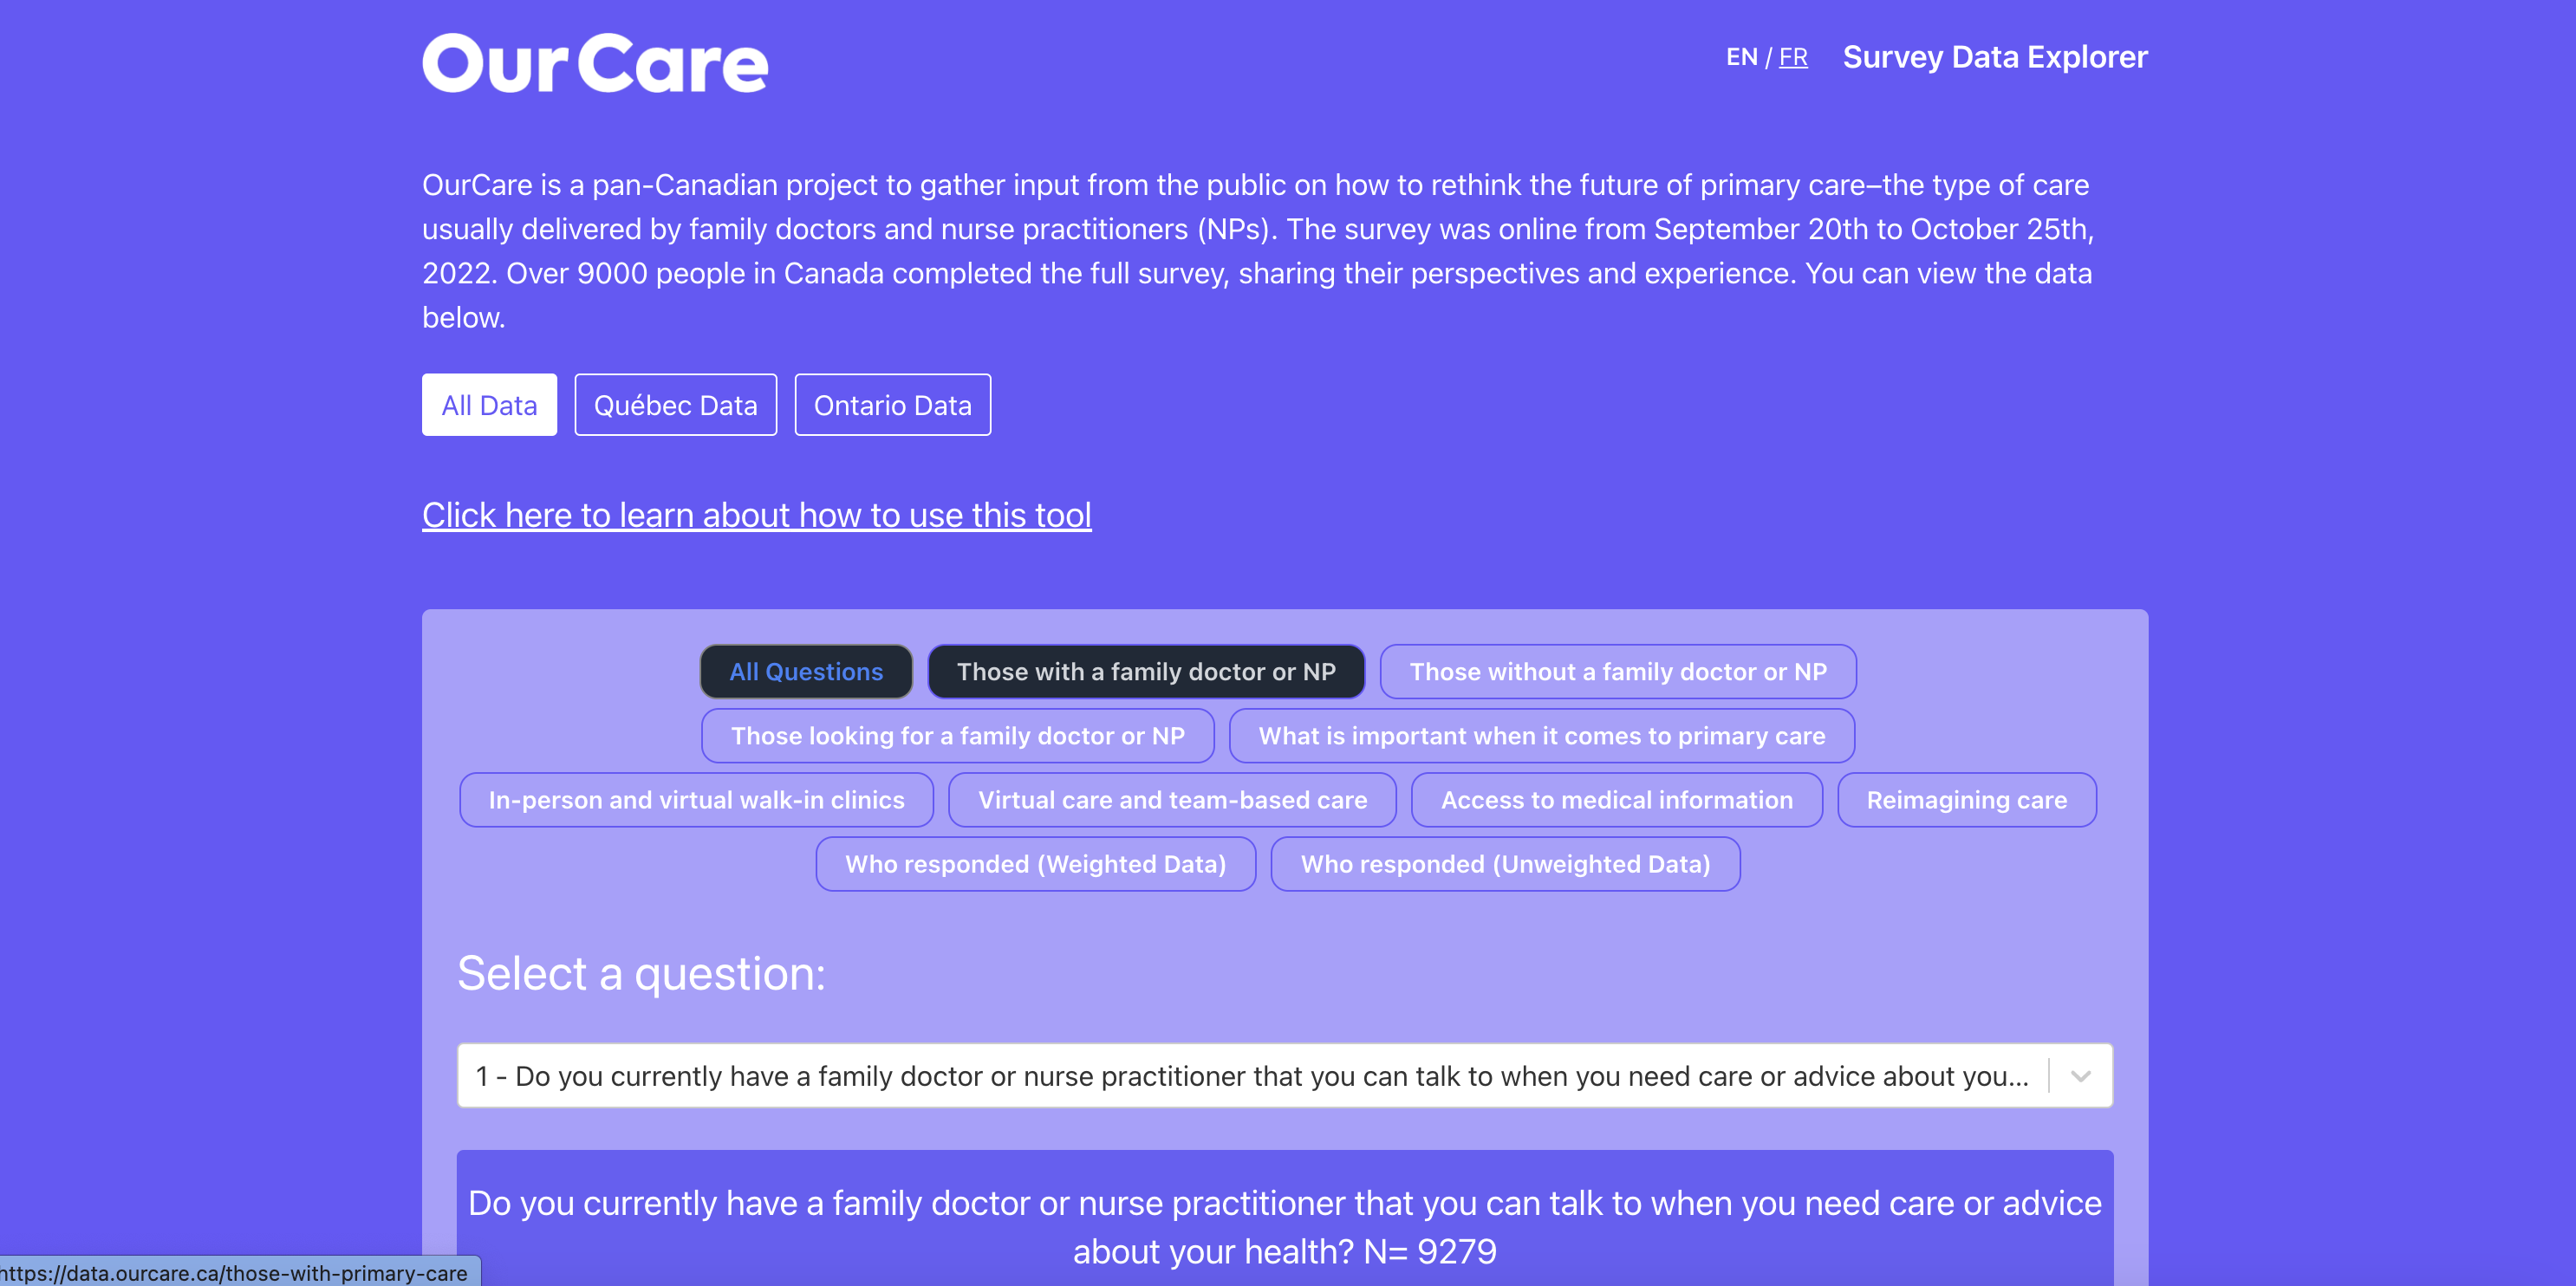
The Survey Dashboard is a customized data visualization tool developed to display the results of a health score-based survey. The dashboard organizes survey responses from various participants, categorizing the data by factors such as location, age, and gender.
Features
- Survey Data Categorization: Organizes survey responses by key demographics such as location, age, gender, etc.
- Health Score Analysis: Displays results based on health-related questions, helping users gain insights into participants' health metrics.
- Data Visualization: Provides visual representations of the survey data using charts, graphs, and other visual elements.
- User-Friendly Dashboard: Easy to navigate, enabling users to quickly analyze survey results and uncover patterns or trends.
- Customizable Insights: Users can filter and customize the data view to focus on specific categories or metrics of interest.
Technology STack
FRONT END
Streamlit - Provides an intuitive and interactive dashboard for visualizing survey data.
BACK END
Python-based data processing - Handles the organization and analysis of survey data.
VISUALIZATION TOOLS
Matplotlib, Plotly - Used to create detailed and interactive visualizations of the survey results.